Matlab Signal Onramp course notes - Part 6: Measurements & Summary
Programmatically measuring earthquake timestamps and concluding the Signal Onramp course.
From App to Code
While the Signal Analyzer app is great for exploration, production workflows often require scripts. You can export your app operations as MATLAB functions or scripts.
1
2
3
4
% Example of a generated preprocessing function
function y = preprocess(x, fs)
    y = bandpass(x, [2 10], fs, 'Steepness', 0.85);
end
Programmatic Signal Measurement
To find the exact timestamps of local earthquakes, we can analyze the spectrogram data.
1. Extracting Spectrogram Data
Using pspectrum, we get the power estimates ($p$), frequencies ($f$), and time instants ($t$).
1
[p, f, t] = pspectrum(wanc_bandpass, fs, 'spectrogram');
2. Calculating Total Power
Sum the power across all frequencies for each timestamp to find “spikes” in activity.
1
2
psum = sum(p);
pwr = db(psum, 'power'); % Convert to decibels for better contrast
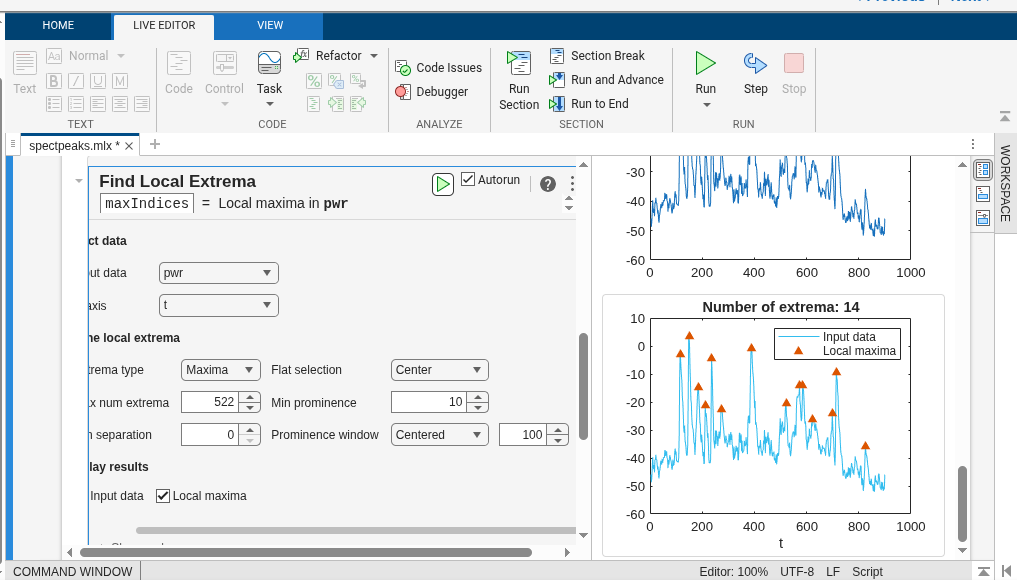
3. Finding Peaks
Use the Find Local Extrema live task or findpeaks to identify the timestamps of earthquakes. Setting a minimum prominence (e.g., 10) helps ignore background noise.
1
2
% Extracting the timestamps
quakeSec = t(maxIndices);
Summary: Signal Processing Workflow
- Import:
readmatrix,readtimetable. - Preprocess:
resample,alignsignals, custom functions. - Spectral Analysis:
pspectrum,cwt. - Filtering:
lowpass,bandpass,highpass. - Measure:
findpeaks,db,sum.
Conclusion
This course provided a hands-on introduction to signal processing in MATLAB. By analyzing real seismic data, I learned how to standardize signals, explore them in both time and frequency domains, and extract meaningful information using filters and peak detection.
My certificate for completing this course is available here.