Matlab Signal Onramp course notes - Part 4: Spectral & Time-Frequency Analysis
Decomposing signals into frequency components using Fourier transforms and spectrograms.
Frequency Analysis
Viewing a signal in the time domain is often insufficient. For instance, the WANC signal looks much noisier than HARP or PAX. By using Fourier transforms, we can decompose the signals into their frequency components.
Power Spectrum
The power spectrum reveals that all three stations recorded similar low-frequency content (around 0.05 Hz). However, the WANC signal has significant power in higher frequencies—rapid oscillations caused by local earthquakes triggered by the main event.
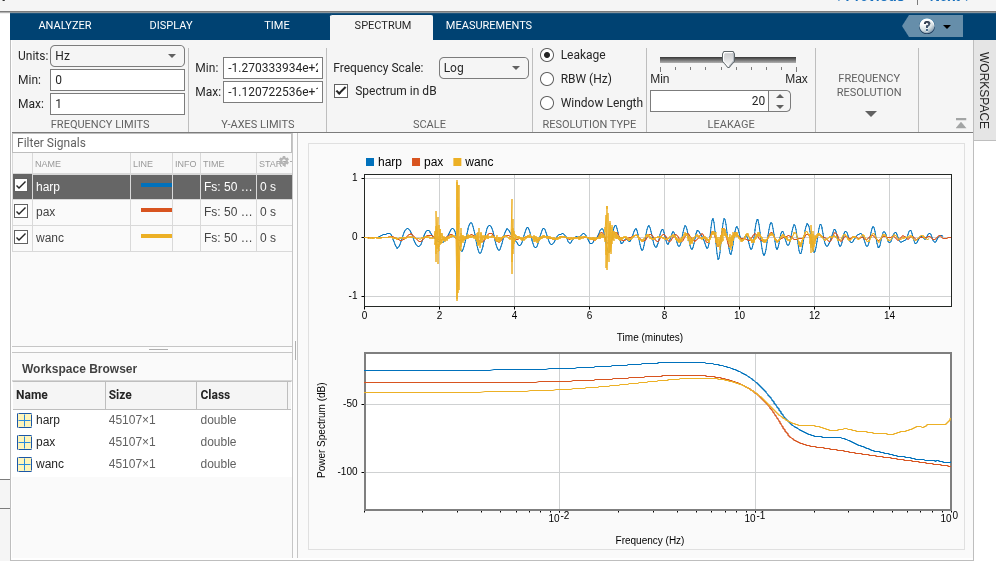 Using a logarithmic x-axis makes it easier to compare low-frequency peaks.
Time-Frequency Analysis
A power spectrum tells us which frequencies exist, but not when they occur. Time-frequency analysis provides both.
Spectrograms vs. Scalograms
- Spectrograms: Use sine waves to slice the signal into short blocks. Good for signals modeled by sines/cosines.
- Scalograms: Use wavelets (pulse shapes). Good for transient pulses or non-stationary signals.
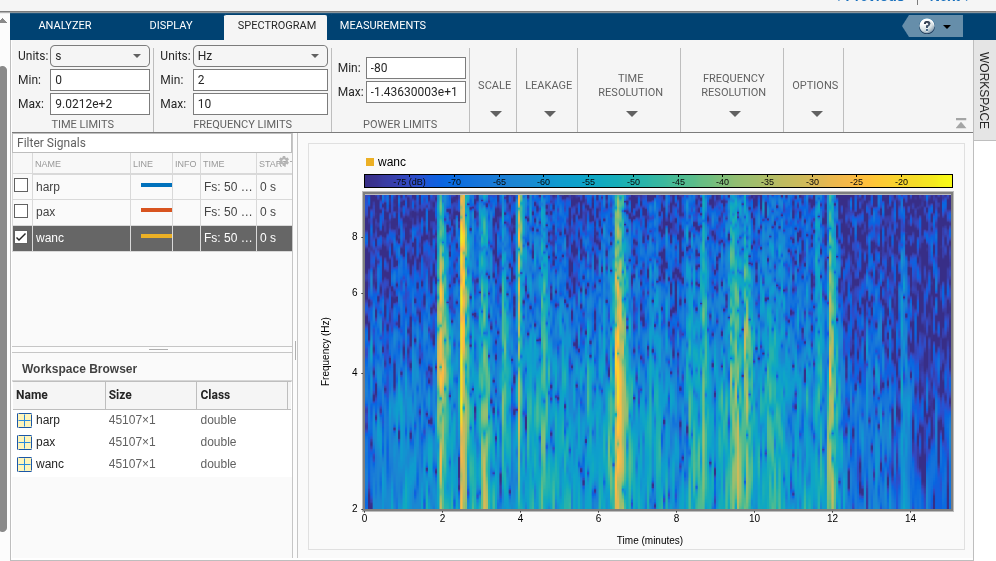
Creating a Spectrogram
For the WANC signal, a spectrogram highlights high-frequency bands that correspond exactly to local tremors.
1
2
3
% Generating a spectrogram in Signal Analyzer
% Set frequency limits to 2-10 Hz to focus on local earthquakes
% Set power threshold to -80 dB to reduce noise
Creating a Scalogram
Switching to a scalogram can provide a different perspective, often useful for identifying the start of sharp transients.
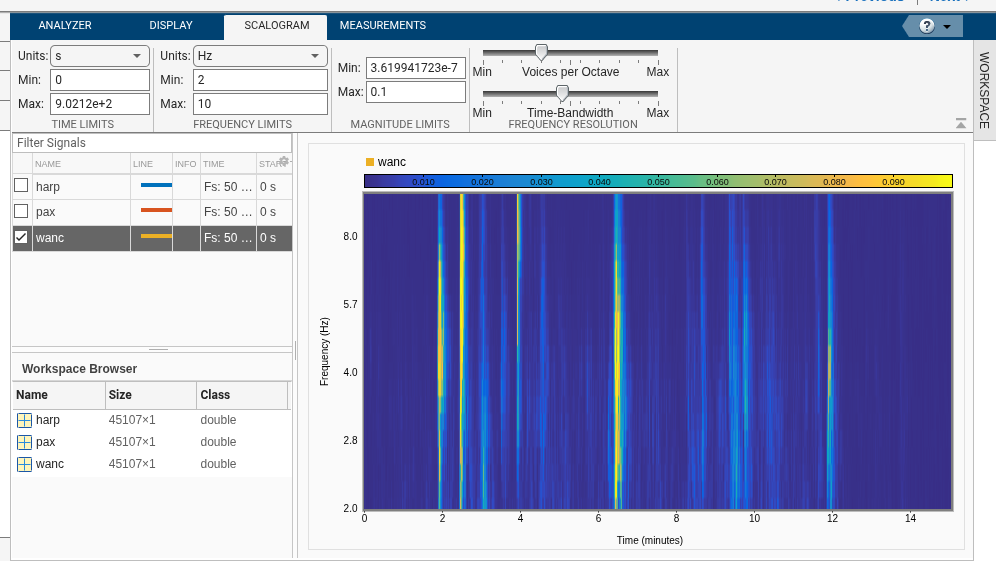
In the next part, we’ll use filters to separate these interesting high-frequency pulses from the main seismic wave.