Matlab Image Processing Onramp: Image Segmentation
Learn how to separate text from background in receipt images using thresholding and binary image processing.
Image Segmentation
Course Example - Photos of Receipts
Receipt Identification Workflow  Figure 1: Workflow with Step 3 Highlighted: Segment
Features of Receipt Images
The main feature of receipt images is dark text on a bright background. How can you leverage this feature?
One method is to separate the text from the background. Separating an image into distinct parts is called segmenting an image. original receipt image next to segmented version of the same image 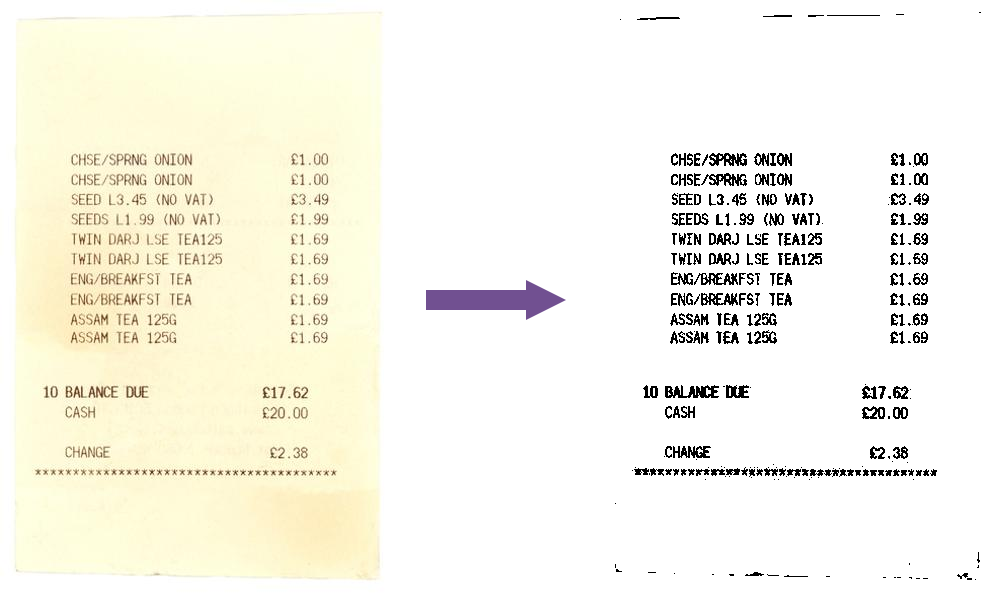 Figure 2: Original vs Segmented Receipt
A receipt image has a pattern of horizontal “stripes” of dark text separated by “stripes” of bright paper.
What is Segmentation?
What Is Image Segmentation? Image segmentation is about identifying regions of interest in an image. Methods include edge detection, texture, and color segmentation. Binary masks identify regions of interest, with values of 1 for pixels in the foreground and 0 for those in the background.
Image segmentation is the task of dividing, or segmenting, an image into regions, like lanes, cars, and road.
There are different ways of doing this depending on your image. For example, you might use edge detection to find the boundary of an object, or you could segment by texture, or by looking for specific shapes and sizes. Segmenting by color is probably the one you’re most familiar with, even if you didn’t know it. Green screens are everywhere, from Hollywood to your local weather forecast. But whatever segmentation method you apply to your image, your goal is to identify regions of interest. For example, in a green screen image, that means differentiating between the foreground, which you want to keep, and the green background.
That’s where a mask comes in. OK, not exactly that kind of mask, but sort of. A binary mask is a logical array that indicates a region of interest. The length and width of the mask are the same as the original image. A value of 1 indicates a pixel you want to keep, and a 0 indicates one you don’t. You can use the mask to work with portions of your image which lets you do things like replace the background, or you can use a mask to identify objects or even do calculations.
Threshold Intensity Values
(1/2) Threshold an Image using Logical Operators
Intensity Thresholding
You can create a binary black-and-white image from a grayscale image by thresholding its intensity values. Values below the cutoff are assigned the value 0, while values above are assigned the value 1.
In the example below, a grayscale image is segmented using a threshold of 1/4 the maximum possible intensity of 255.
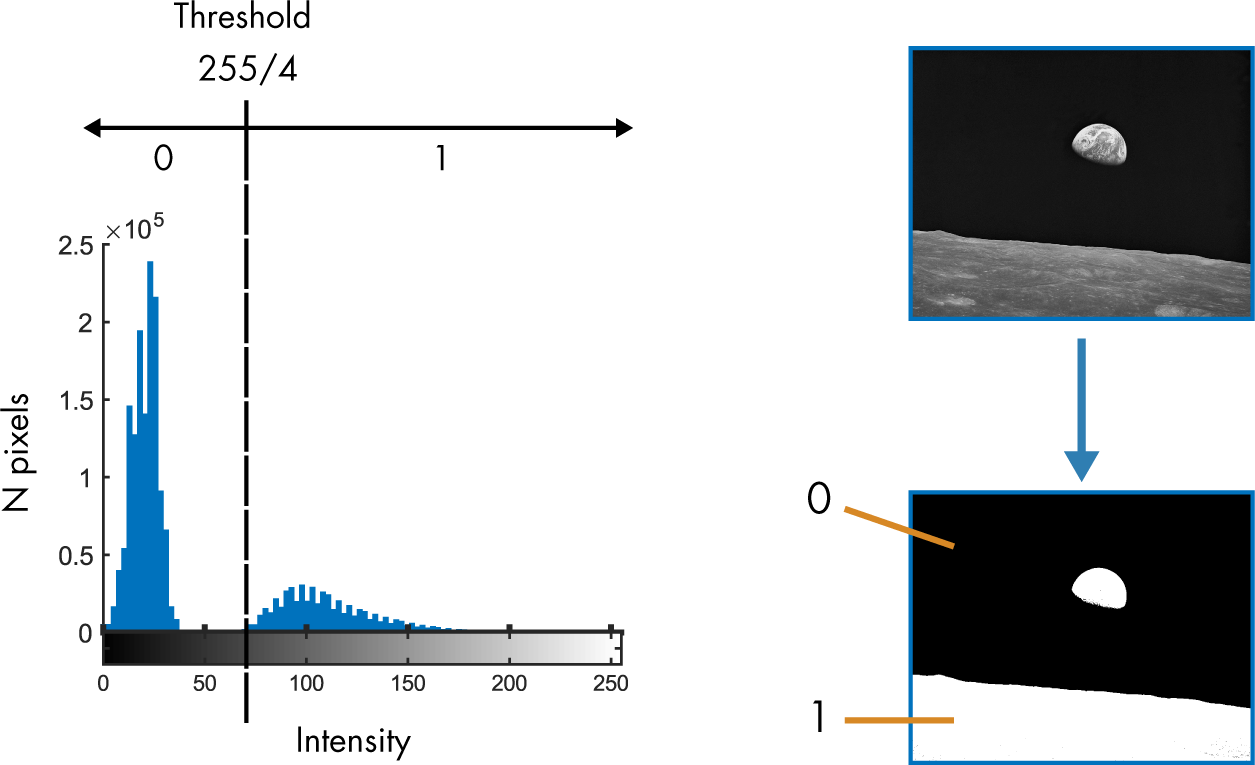 Figure 3: Grayscale image next to its histogram. The histogram is split and the resulting binary mask is shown.
Background When applied to arrays, logical operators like < and > generate arrays of the same size that contain logical values 1 (true) or 0 (false).
You can use logical operators to threshold the intensity values of a grayscale image, creating a binary image.
1
B = g > thresh;
Task Create a binary image BW by thresholding gsAdj at half the maximum possible intensity (the maximum intensity is 255).
Display BW using imshow.
1
2
BW = gsAdj > (255/2);
imshow(BW)
That didn’t quite work; some of the receipt text is light gray and washed out by the threshold. You can identify a better cutoff value by looking at the image’s intensity histogram. Task Plot the intensity histogram for gsAdj.
1
imhist(gsAdj)
The histogram shows a large peak between 220 and 250, which contains the bright pixels in the paper and background. To create a better segmentation, you can use a threshold that’s just below this peak. Task Threshold gsAdj at 200 and store the result in BW. Display BW.
1
2
BW = gsAdj > (200);
imshow(BW)
Repeat the steps above for IMG_004.jpg. Does the same threshold value work well for this receipt? If not, which threshold value creates the best binary image?
When you’re ready, you can move on to the next section.
1
2
3
4
5
6
7
img = imread("IMG_004.jpg");
gs = im2gray(img);
gsAdj = imadjust(gs);
imshow(gsAdj)
imhist(gsAdj)
BW = gsAdj > (170);
imshow(BW)
(2/2) Automate Threshold Selection
The ultimate goal is to create an algorithm that can process all of our images. Unfortunately, receipt images taken in different lighting conditions have varied contrast and require different thresholds. Manually identifying a threshold using the intensity histogram works but is impractical for thousands of images.
To automate the threshold selection process, you can use the imbinarize function, which calculates the “best” threshold for the image.
1
gBinary = imbinarize(g);
For more information about how this threshold is determined, see the documentation for imbinarize. Task Use imbinarize to create a binary image BW from gsAdj and display BW.
1
2
BW = imbinarize(gsAdj);
imshow(BW)
That did okay, but manual threshold selection performed better. The text in the top half of the receipt isn’t as clear as the text in the bottom half.
By default, imbinarize uses a global threshold value — the same threshold for every pixel in the image.
You can have imbinarize look at smaller regions of the image and pick the best threshold for that region by passing the “adaptive” option as the second argument to imbinarize.
1
gBinary = imbinarize(g,"adaptive");
Task Use imbinarize with the “adaptive” option to create a binary image from gsAdj. Store the result in BWadapt.
Display gsAdj and BWadapt together in a montage using imshowpair.
1
2
BWadapt = imbinarize(gsAdj, "adaptive");
imshowpair(gsAdj, BWadapt, "montage")
That doesn’t seem to have helped. The text now appears completely washed out in black. What happened?
By default, the foreground of an image is assumed to be bright and the background dark. But for receipts, the foreground is the dark text, and the background is bright.
In imbinarize, you can designate whether the foreground is bright or dark by setting the “ForegroundPolarity” option.
1
2
gBinary = imbinarize(g,"adaptive", ...
            "ForegroundPolarity","dark")
Task Use imbinarize with the “adaptive” option and “ForegroundPolarity” set to “dark” to create a binary image from gsAdj. Store the result in BWadapt.
Display gsAdj and BWadapt in a montage using imshowpair.
1
2
BWadapt = imbinarize(gsAdj, "adaptive", "ForegroundPolarity","dark");
imshowpair(gsAdj, BWadapt, "montage")
How does this help you identify whether an image has text?
Try creating a binary image from IMG_005.jpg using adaptive thresholding. Display the result together with BWadapt created in Task 3. Do you notice any characteristics you could use to distinguish receipts from non-receipts?
Often, you need to do something with a binary mask, such as apply it to the image or analyze its contents, so that it helps you with your image processing problem.
1
2
3
4
5
6
7
img = imread("IMG_005.jpg");
gs = im2gray(img);
gsAdj = imadjust(gs);
imshow(gsAdj)

BWadapt = imbinarize(gsAdj, "adaptive", "ForegroundPolarity","dark");
imshowpair(gsAdj, BWadapt, "montage")
Work with Binary Images
(1/2) Use a Binary Image as an Array
Identifying Text Patterns
You’ve improved the visibility of the text in a binary image. Now how can you determine if the image is a receipt? The answer lies in the pattern of text in the image.
The rows of pixels that contain text have more 0 threshold values, and the rows between lines of text have more 1s. If you sum the values across each row, the rows with text have smaller sums than the rows without text.
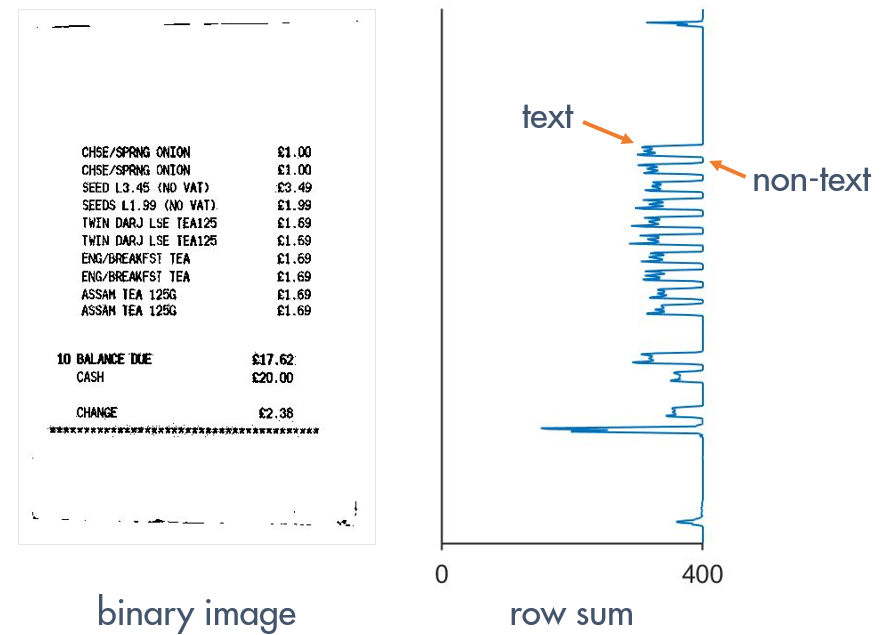 Figure 4: Binarized receipt next to a plot of its row sum. Dips in the row sum align with text in the receipt.
You can compute the sums across rows of an array by using the sum function operating along the second dimension of the array.
1
rSum = sum(BW,2)
Task Use sum to compute the row sum of BW. Store the result in S.
1
2
size(BW)
S = sum(BW,2)
Task Use the plot function to plot the row sum S.
1
plot(S)
Notice the distinctive pattern in the row sum signal: alternating higher sums (blank white space) and lower sums (rows of text). For images without text, this pattern should generally be absent. Task Compute the row sum of BW2 and store it in S2. Then plot S2.
1
2
S2 = sum(BW2,2);
plot(S2)
Can you tell if an image contains a receipt by looking at the row sum plot alone?
Read IMG_018.jpg into the workspace. Without viewing the image, process the image using im2gray, imadjust, and imbinarize, and then compute and plot the row sum. Is it a receipt?
Now display the image with imshow. Were you right? If so, how did you know?
1
2
3
4
5
6
7
8
9
10
I = imread("IMG_006.jpg");
gs = im2gray(I);
gsAdj = imadjust(gs);
BW = imbinarize(gsAdj,"adaptive","ForegroundPolarity","dark");

size(BW)
S = sum(BW,2);

plot(S)
imshow(I)
(2/2) Compare Segmentations of Various Images
Some receipt images have elements that distort the text pattern’s oscillations in the row sum plot, making them harder to classify. Task Select Image 7 from the drop-down list. Do you see any features of the image that could distort the row sum? 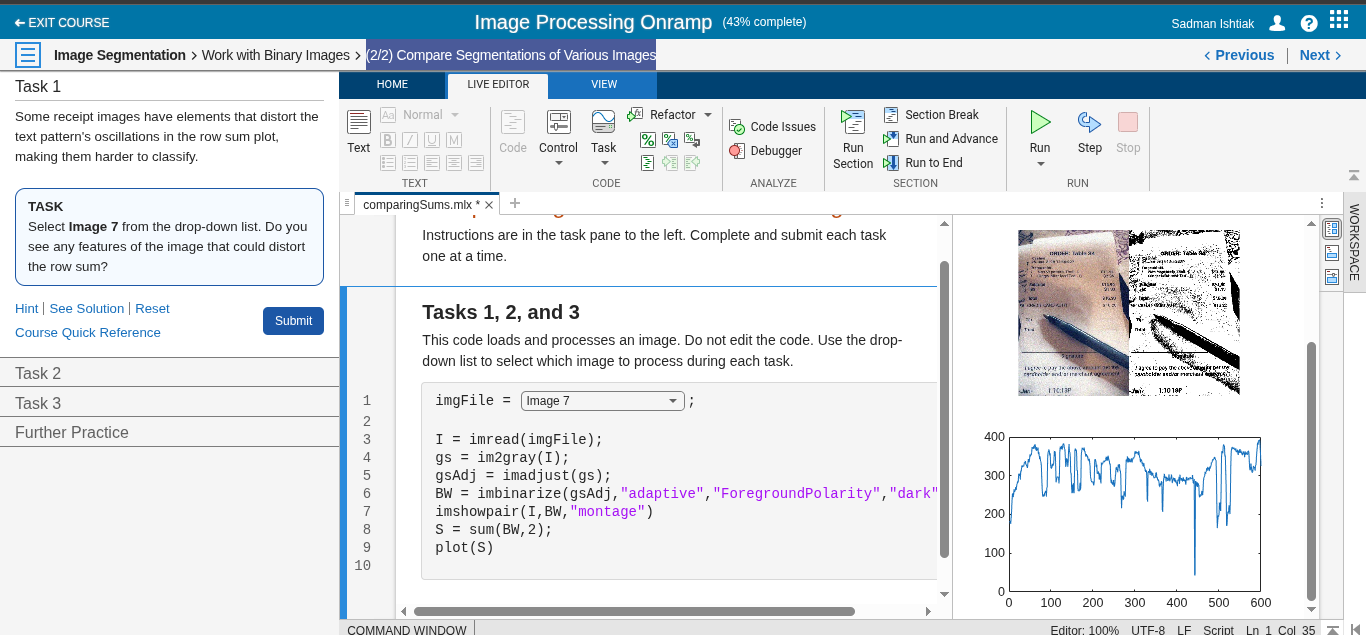 Figure 5: Noisy Receipt Example
Did you notice the noise in Image 7? It’s prominent enough to appear as specks in the binary image, and distort the text pattern in the row sum plot. Removing the noise would make the text pattern more prominent.
Take a look at another receipt image. Do you see any features in Image 10 that could distort the row sum? Task Set the drop-down list to Image 10. 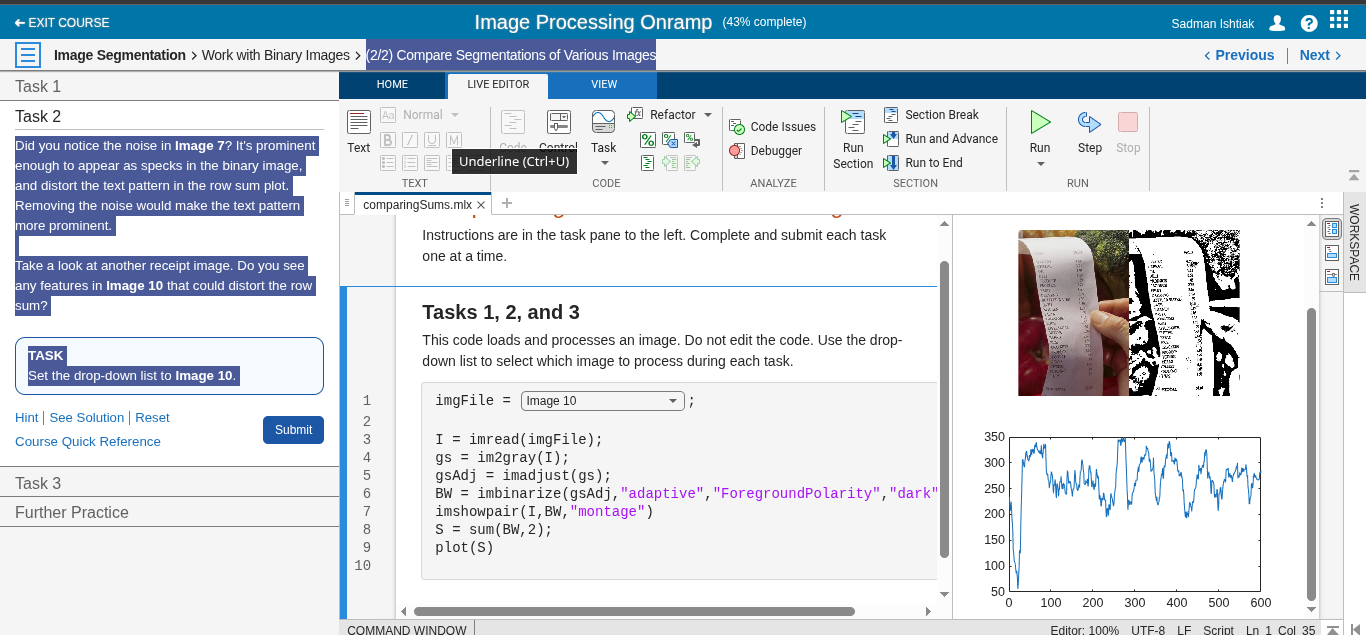 Figure 6: Produce Background Example
You probably noticed Image 10 has some produce in the background. These healthy foods are essential to a balanced diet but are less desirable when classifying receipts. They produce large fluctuations in the row sum plot that obscure the smaller text pattern. Removing the background produce would make the text pattern more noticeable.
Analyze the row sum for one more image. Notice anything in Image 2? 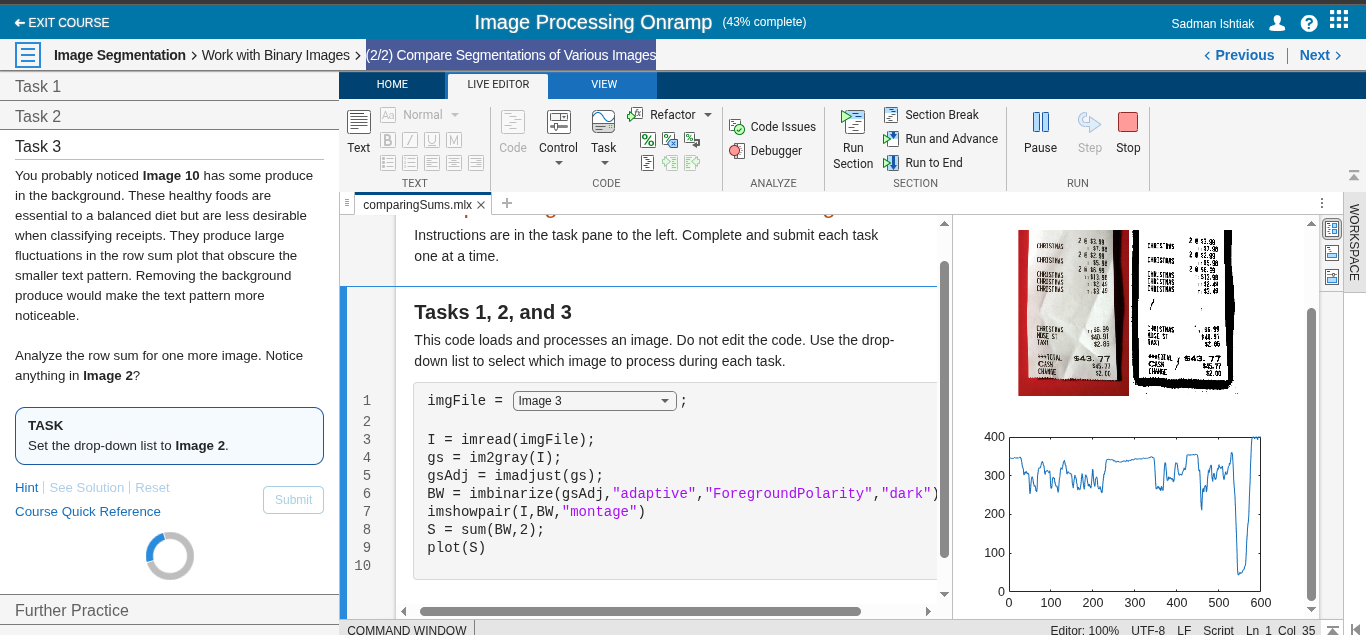 Figure 7: Grid Background Example
Like Image 10, Image 2 has background artifacts that distort the row sum. The grid is similar in size and intensity to text, so it is more difficult to remove than other backgrounds. Instead, you could amplify the strength of the desired signal (in this case, the oscillations resulting from rows of text). Can you think of a way to augment this pattern?
Try processing the rest of the images available in the drop-down list. Do you notice any other features that could distort the row sums of receipt images?
When you’re ready, you can move on to the next section.